


Table of Contents
- What Is a Fantasy Trade Value Chart?
- Why Dynasty Football Requires a Trade Value Chart
- How Fantasy Trade Value Charts Are Created
- Sample Chart: Top 10 Values
- Position-by-Position Trade Values
- Interpreting Player Tiers and Rankings
- Using the Chart in Your Dynasty League
- Adjusting for League Settings and Scoring Formats
- Tools and Resources for Updated Trade Values
- Common Mistakes to Avoid with Trade Value Charts
- How Trade Value Charts Are Changing
- Frequently Asked Questions
- Conclusion
- Related Guides
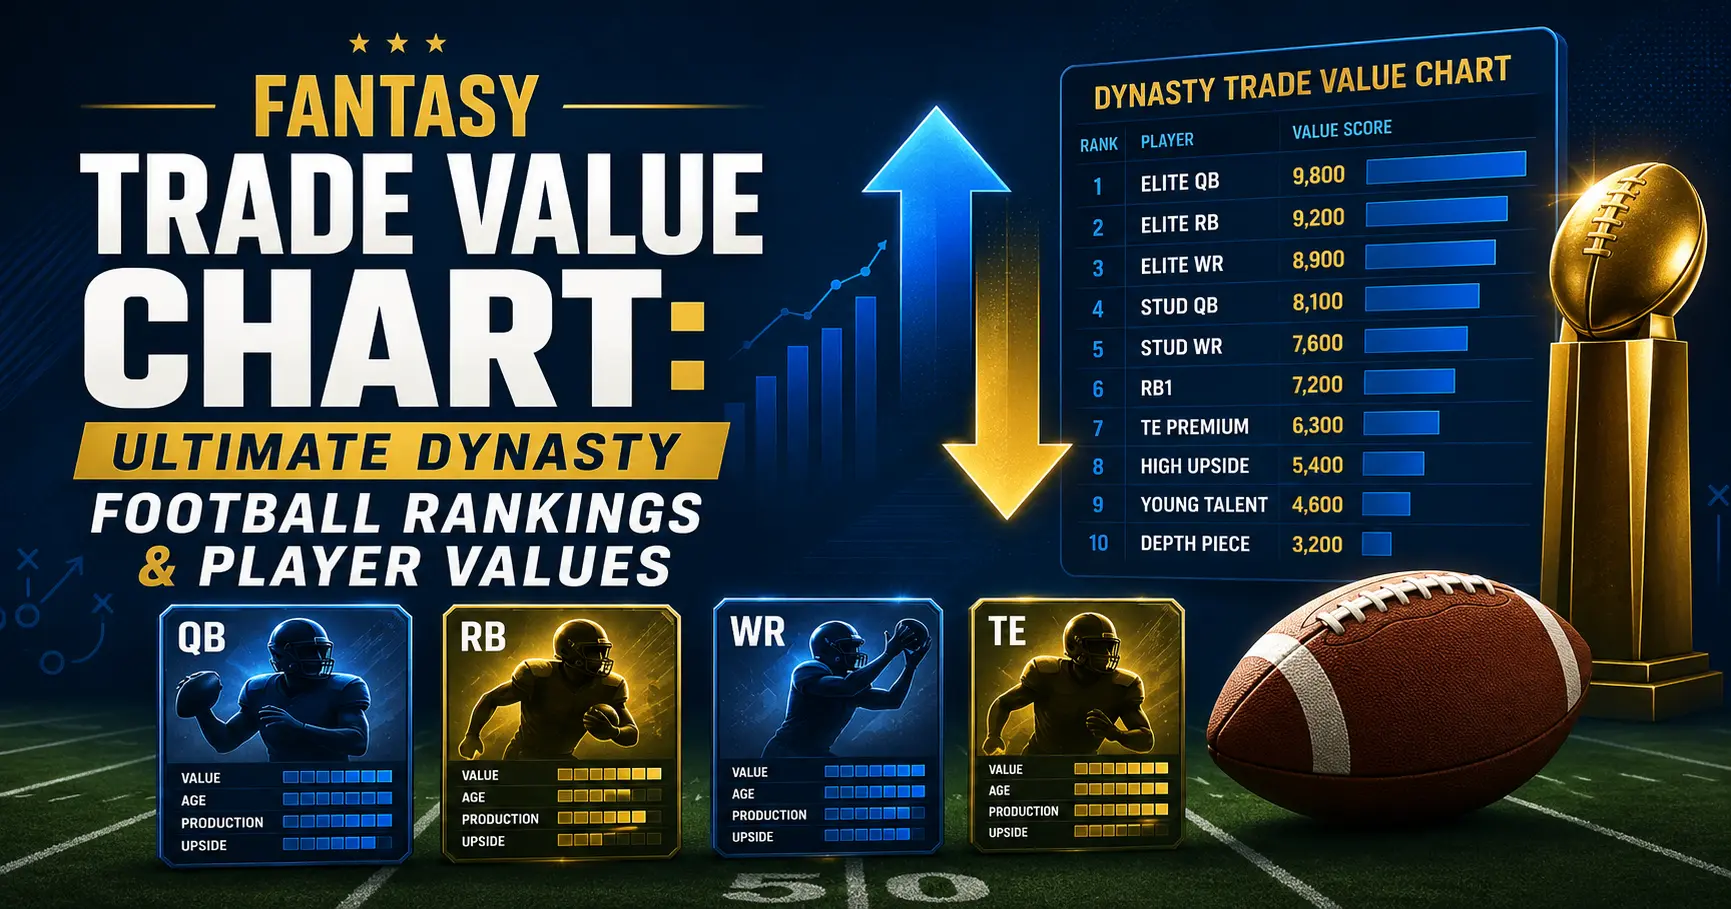
A fantasy trade value chart turns every player into a number, so you can compare the two sides of a trade without guessing. This guide explains how the numbers are built, how to read the index, tier and format columns, and where a chart stops being enough.
What Is a Fantasy Trade Value Chart?
A fantasy trade value chart is a ranked list in which each player has a trade value. In a dynasty league that value covers future seasons as well as this one, which is why a young receiver can sit above an older player who scores more points today.
Our own version is the dynasty trade value chart, which lists player values for 1QB and Superflex leagues. A fantasy trade value chart built for redraft would rank those two players the other way round.
Why Dynasty Football Requires a Trade Value Chart
In dynasty you keep your players from year to year, so a bad trade can hurt for several seasons. A chart gives you a shared scale for players of different ages and positions. It stops you paying long-term prices for short-term production, and it shows when a pick is worth more than a veteran. Without a fantasy trade value chart, managers fall back on names and last week’s points.
How Fantasy Trade Value Charts Are Created
Charts are built in one of three ways. Some use expert rankings. Some use crowd votes from thousands of managers. Some use real completed trades. Each method has blind spots, which is why two charts can disagree on the same player.
Most charts convert those inputs to an index. On ours, the top player is 10,000 and every other value is measured against that. Our methodology explains how the index is set and where it can be wrong. Whichever method a fantasy trade value chart uses, check its update date before you trust it.
Sample Chart: Top 10 Values
This is the top of our own chart, last updated July 4, 2026. It is an editorial snapshot, so check the full dynasty trade value chart for the current numbers.
| Rank | Player | Position | 1QB index | Superflex index | Tier |
|---|---|---|---|---|---|
| 1 | Bijan Robinson | RB | 10,000 | 10,000 | 1 |
| 2 | Ja’Marr Chase | WR | 9,750 | 9,750 | 1 |
| 3 | Jahmyr Gibbs | RB | 9,510 | 9,280 | 1 |
| 4 | Jaxon Smith-Njigba | WR | 9,280 | 9,050 | 1 |
| 5 | Puka Nacua | WR | 9,050 | 8,610 | 2 |
| 6 | Brock Bowers | TE | 8,190 | 8,390 | 2 |
| 7 | Ashton Jeanty | RB | 8,820 | 7,600 | 2 |
| 8 | Josh Allen | QB | 6,700 | 9,510 | 2 |
| 9 | Jeremiyah Love | RB | 8,390 | 7,410 | 3 |
| 10 | Amon-Ra St. Brown | WR | 7,790 | 7,990 | 3 |
Read across a row to see how format changes value. Josh Allen is 6,700 in 1QB and 9,510 in Superflex, because a second quarterback slot makes reliable starters scarce.
Position-by-Position Trade Values
| Position | Short-term value | Long-term value | What to remember |
|---|---|---|---|
| Quarterback | Moderate in 1QB, high in Superflex | High | Format decides almost everything |
| Running back | High | Moderate | Value can fall quickly with age |
| Wide receiver | Moderate | High | Holds value longest |
| Tight end | Low to moderate | Moderate | Only a few elite options |
| Rookie pick | None until drafted | High for early picks | Value rises near the draft |
Current pick estimates are on our rookie pick values page.
Interpreting Player Tiers and Rankings
A tier groups players of similar value. The gap between two tiers matters far more than the gap between two neighbors in the same tier. If you can move down within a tier and collect an extra pick, you have usually gained value.
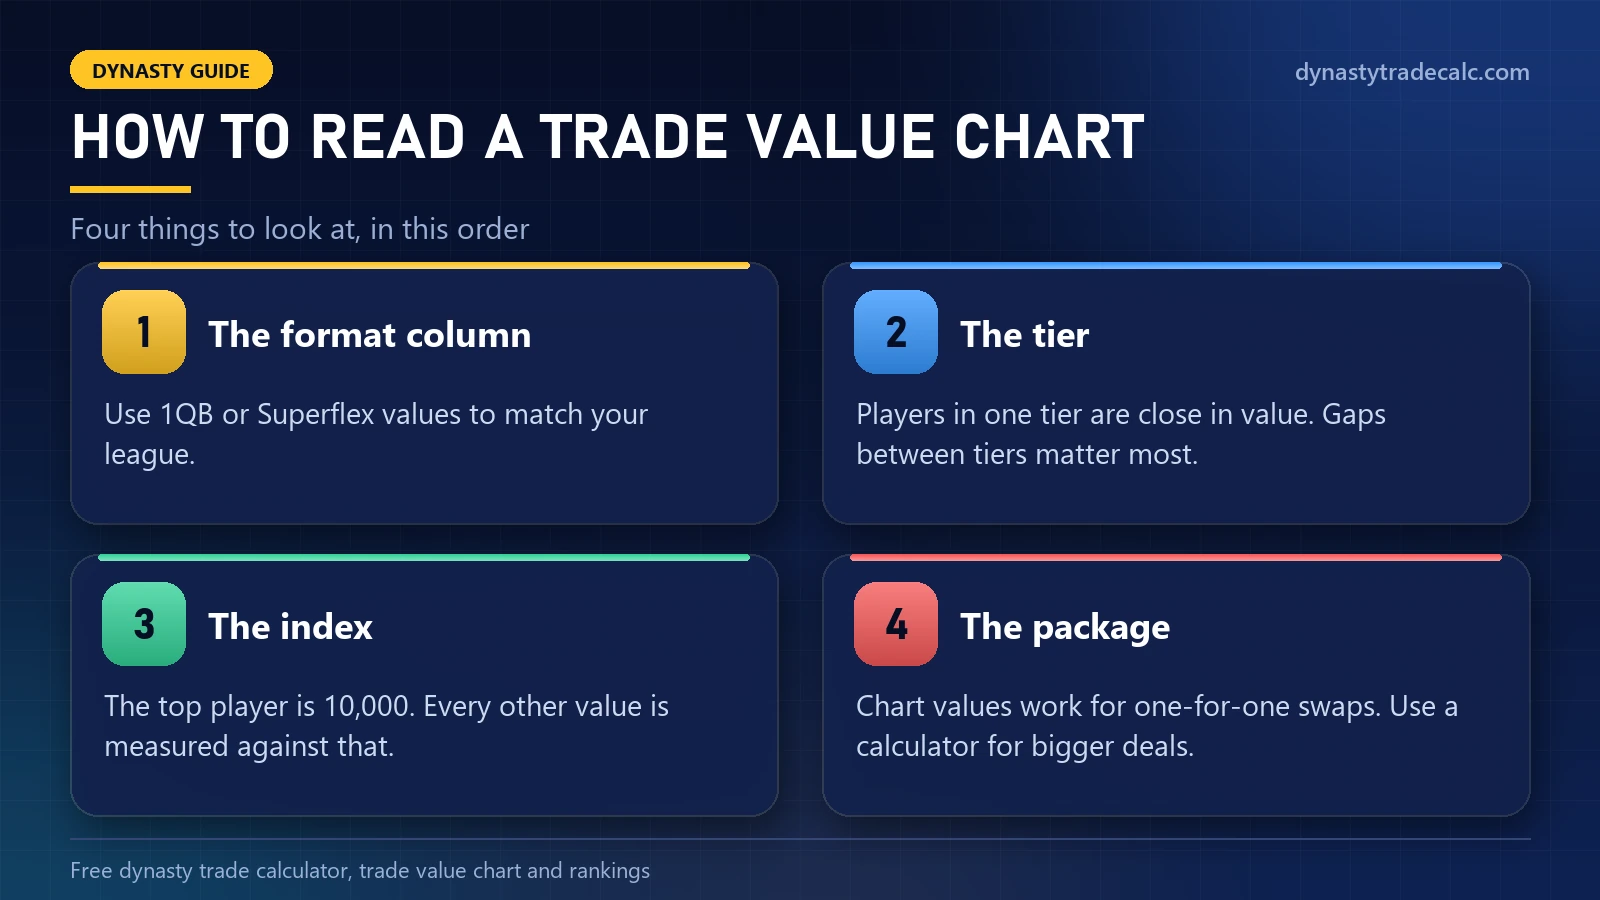
Rankings show order. Tiers show where the real drops are. Use both, and see our dynasty rankings for the current order in 1QB and Superflex. On a fantasy trade value chart, a tier break is the clearest sign that one side of a trade is giving up more.
Using the Chart in Your Dynasty League
- Pick the column that matches your format: 1QB or Superflex.
- Look up every player and pick in the offer.
- Compare the tiers first, then the index values.
- For a one-for-one swap, the higher index is ahead on paper.
- For anything larger, run the trade through the dynasty trade calculator, because package size changes the result.
Adjusting for League Settings and Scoring Formats
A chart only helps if it matches your league. Superflex raises every starting quarterback. PPR scoring raises receivers and pass-catching backs. Tight-end premium raises the top tight ends. League size matters too, because deeper leagues make starters scarcer.
See the Superflex trade calculator guide and the Superflex trade value chart guide for format-specific detail.
Tools and Resources for Updated Trade Values
- Our dynasty trade value chart for player values in both formats.
- Our dynasty rankings for the current order of players.
- Our rookie pick values for picks by round and range.
- A second, independent source, listed at the end of this page, for a sanity check.
Common Mistakes to Avoid with Trade Value Charts
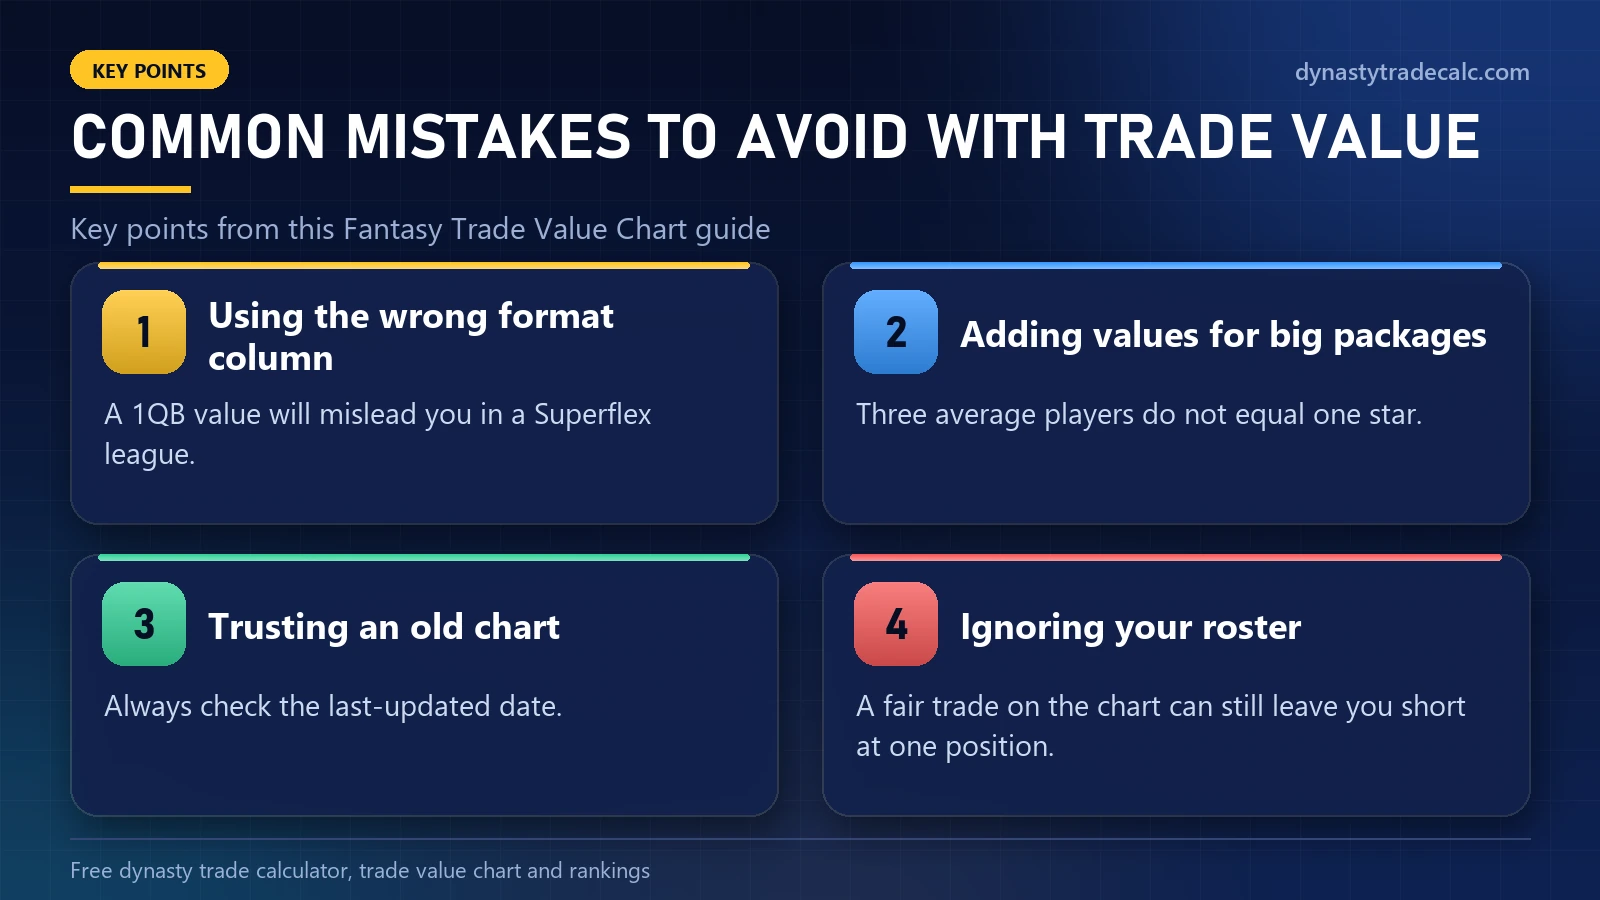
- Using the wrong format column. A 1QB value will mislead you in a Superflex league.
- Adding values for big packages. Three average players do not equal one star.
- Trusting an old chart. Always check the last-updated date.
- Ignoring your roster. A fair trade on the chart can still leave you short at one position.
More examples are in the biggest dynasty trade mistakes.
How Trade Value Charts Are Changing
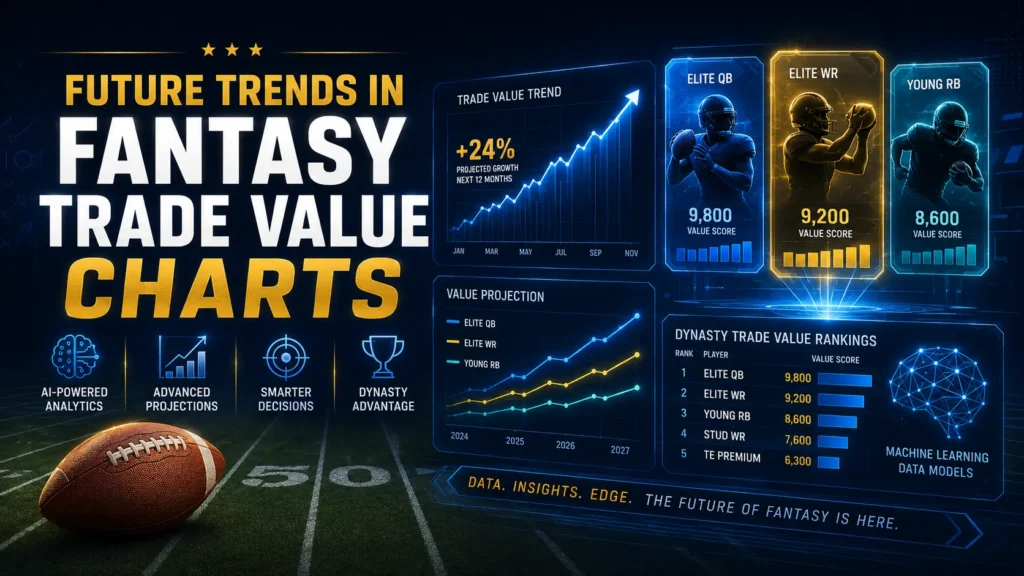
Charts used to be updated a few times a year by one analyst. Many are now refreshed much more often, using crowd votes or completed trades. That makes them quicker to react to news, and also quicker to overreact to hype. The safest habit has not changed: compare two sources and apply your own judgment. A fantasy trade value chart is best for single players; a calculator is best for packages.
Frequently Asked Questions
What is a fantasy trade value chart used for?
It is a list that gives every player a number for trade purposes. You compare the numbers on each side of a deal to see who is giving up more. In dynasty leagues the numbers also reflect age and future seasons.
How do I read a trade value chart?
Find each player in the deal, note the index for your league format, and compare the two sides. Then look at the tier. Players in the same tier are close in value, so small index gaps between them matter less.
How often should a trade value chart be updated?
Check for a new version after major news such as injuries, trades and the NFL Draft. Always look at the last-updated date on the chart before you rely on it for an offer.
Can I use the same chart for every league?
No. A 1QB chart undervalues quarterbacks in Superflex, and PPR scoring lifts pass catchers. Use the column or chart that matches your league’s lineup and scoring.
Do rookie picks appear on a trade value chart?
Many charts list rookie picks beside players, because picks are traded like players in dynasty. Early first-round picks carry the most value, and value falls in later rounds.
Can I add chart values together to judge a trade?
For a one-for-one swap, yes. For trades with several players or picks, use a trade calculator instead. Two mid-value players rarely equal one star, even when the totals match.
How do I avoid overpaying in a trade?
Compare tiers before index points, favor the side that gets the best player, and check a second source. If the other side’s total is clearly higher, ask for an extra pick or walk away.
What is a fantasy football trade value chart?
A fantasy football trade value chart lists a trade value for every player, and often rookie picks, so you can compare both sides of a deal. In dynasty leagues the values also reflect age and future seasons.
How do I use a trade value chart in fantasy football?
Look up every player in the offer on a trade value chart for fantasy football, read the tier first and then the number. If you need a quick trade value chart fantasy football check, compare tiers before totals.
Where do fantasy trade values come from?
Fantasy trade values come from expert rankings, crowd votes or completed trades, depending on the site. That is why two charts can disagree on the same player.
What is a trade chart in fantasy football?
A trade chart in fantasy football is a list of player values used to compare trades. Many managers search for a trade chart fantasy football version; it is the same as a trade value chart.
Conclusion
A fantasy trade value chart gives you a common scale for very different players. Match the chart to your format, read the tier before the index, and use a calculator for larger packages. Do that consistently and you will overpay far less often.
Related Guides
Compare With Other Sources
Values on this page are editorial estimates. Compare them with KeepTradeCut crowd-sourced dynasty values, FantasyCalc and FantasyPros dynasty rankings before you commit to a trade. You can also run the same trade through our dynasty trade value chart.
