


Table of Contents
- What Is a Superflex Trade Value Chart?
- How the Chart Works in Dynasty Fantasy Football
- Superflex Top 12 Snapshot
- Key Factors That Impact Player Values in Superflex Leagues
- Quarterback Value Explained in Superflex Formats
- Running Back Trade Value Trends in Dynasty Leagues
- Wide Receiver Dynasty Value Strategy
- Tight End Premium Value Impact in Superflex Leagues
- Rookie Picks and Draft Capital Value in Dynasty Trades
- Superflex Value by Position at a Glance
- Buy Low and Sell High Trade Strategy
- Mistakes to Avoid in Dynasty Trades
- FAQ
- Related Guides
Dynasty fantasy football in the USA feels like a constant chess match. One wrong trade can cost you a season. That is why a superflex trade value chart becomes your silent coach. It helps you judge player worth with logic instead of emotion, so you build a roster that lasts beyond one lucky week.
What Is a Superflex Trade Value Chart?
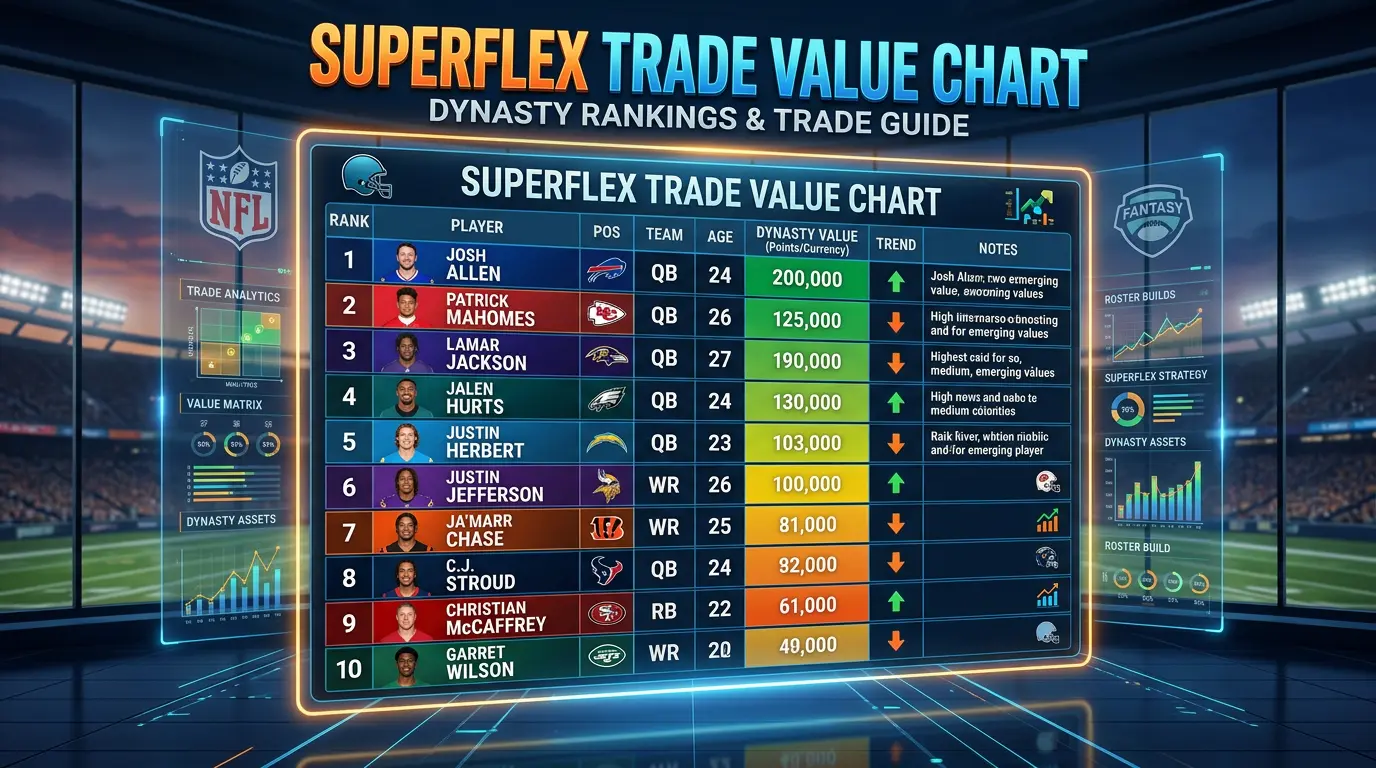
A superflex trade value chart is a structured guide that assigns value to every fantasy football player. It adjusts for superflex formats where quarterbacks carry extra importance. You are not just ranking talent here. You are measuring scarcity, longevity, and weekly starting power in one system.
Many managers also run the same players through a dynasty trade calculator, but a chart gives a clearer long-term view than raw point projections.
How the Chart Works in Dynasty Fantasy Football
This type of trade chart works by assigning numeric values to players based on position, age, performance, and opportunity. In superflex leagues, quarterbacks rise sharply because you can start two of them every week.
For example, a mid-tier quarterback can sometimes match a top wide receiver in trade value. That feels odd at first, but it reflects real demand in superflex formats. Charts built for redraft leagues or other sports do not carry over, because dynasty Superflex values look several seasons ahead. On a Superflex trade value chart, that gap shows up as a quarterback priced next to receivers who score more fantasy points.
Superflex Top 12 Snapshot
This is the top of our own Superflex board, taken from our dynasty rankings page, last updated July 4, 2026. It is an editorial snapshot, so check that page for the current order before you trade.
| Rank | Player | Position | Team | Tier |
|---|---|---|---|---|
| 1 | Josh Allen | QB | BUF | 1 |
| 2 | Ja’Marr Chase | WR | CIN | 1 |
| 3 | Drake Maye | QB | NE | 1 |
| 4 | Bijan Robinson | RB | ATL | 1 |
| 5 | Jaxon Smith-Njigba | WR | SEA | 2 |
| 6 | Jahmyr Gibbs | RB | DET | 2 |
| 7 | Jayden Daniels | QB | WAS | 2 |
| 8 | Puka Nacua | WR | LAR | 2 |
| 9 | Caleb Williams | QB | CHI | 2 |
| 10 | Lamar Jackson | QB | BAL | 2 |
| 11 | Joe Burrow | QB | CIN | 2 |
| 12 | Amon-Ra St. Brown | WR | DET | 3 |
Quarterbacks take 6 of the first 12 spots. That is the Superflex effect in one line: reliable starters sit beside the best receivers and running backs. Full values by position are on our dynasty trade value chart. Any Superflex trade value chart that does not show this pattern is probably built for 1QB leagues.
Key Factors That Impact Player Values in Superflex Leagues
Player value shifts constantly in dynasty football. Age is the first major factor. Younger players usually carry more future upside. Production matters too, but long-term opportunity matters even more in superflex formats.
Team situation also plays a big role. A locked-in starting quarterback holds massive value. Meanwhile, injuries can instantly drop a player’s worth. League size matters too. In 14- and 16-team leagues, starting quarterbacks run out sooner, so scarcity pushes their value even higher. A good Superflex trade value chart moves that player down quickly when his job is in doubt.
Quarterback Value Explained in Superflex Formats
Quarterbacks dominate dynasty trades because they are scarce starters in superflex lineups. You often need at least two reliable QBs, which increases demand dramatically compared to other positions.
A strong QB2 can sometimes equal an elite wide receiver in trade discussions. Leagues that force two starters push quarterbacks higher still. See our 2QB dynasty trade calculator guide.
Running Back Trade Value Trends in Dynasty Leagues
Running backs are high-risk assets in dynasty formats. They score heavily but often have shorter careers. One injury or decline can reduce value quickly, which makes timing extremely important.
However, elite running backs still win championships when healthy. The key is knowing when to sell. Many managers move running backs for longer-lasting assets before the decline begins, sometimes through a three-team trade. Check the Superflex trade value chart each month so you sell while the price is still high.
Wide Receiver Dynasty Value Strategy
Wide receivers are the backbone of stable dynasty rosters. They age slower than running backs and often improve with experience. This makes them safer long-term investments in superflex leagues. PPR scoring adds to that, as our PPR trade calculator guide explains.
Young receivers especially can gain value every season. You can build a full competitive core around WR depth alone. Unlike volatile positions, receivers give you consistent trade flexibility year after year. That is why receivers sit so steadily on a Superflex trade value chart from one season to the next.
Tight End Premium Value Impact in Superflex Leagues
Tight ends are rare difference-makers in dynasty football. Only a few players consistently produce elite weekly numbers, which makes the position extremely valuable at the top end.
Still, tight end production is unpredictable. Some players break out early, while others never develop. This creates a wide value gap between elite TEs and the rest of the field, making smart targeting very important in trades. Read the tight end section of the Superflex trade value chart by tier, not by rank.
Rookie Picks and Draft Capital Value in Dynasty Trades
Rookie picks are one of the most powerful assets in dynasty football. A first-round pick can become a franchise quarterback or elite skill player depending on the draft class.
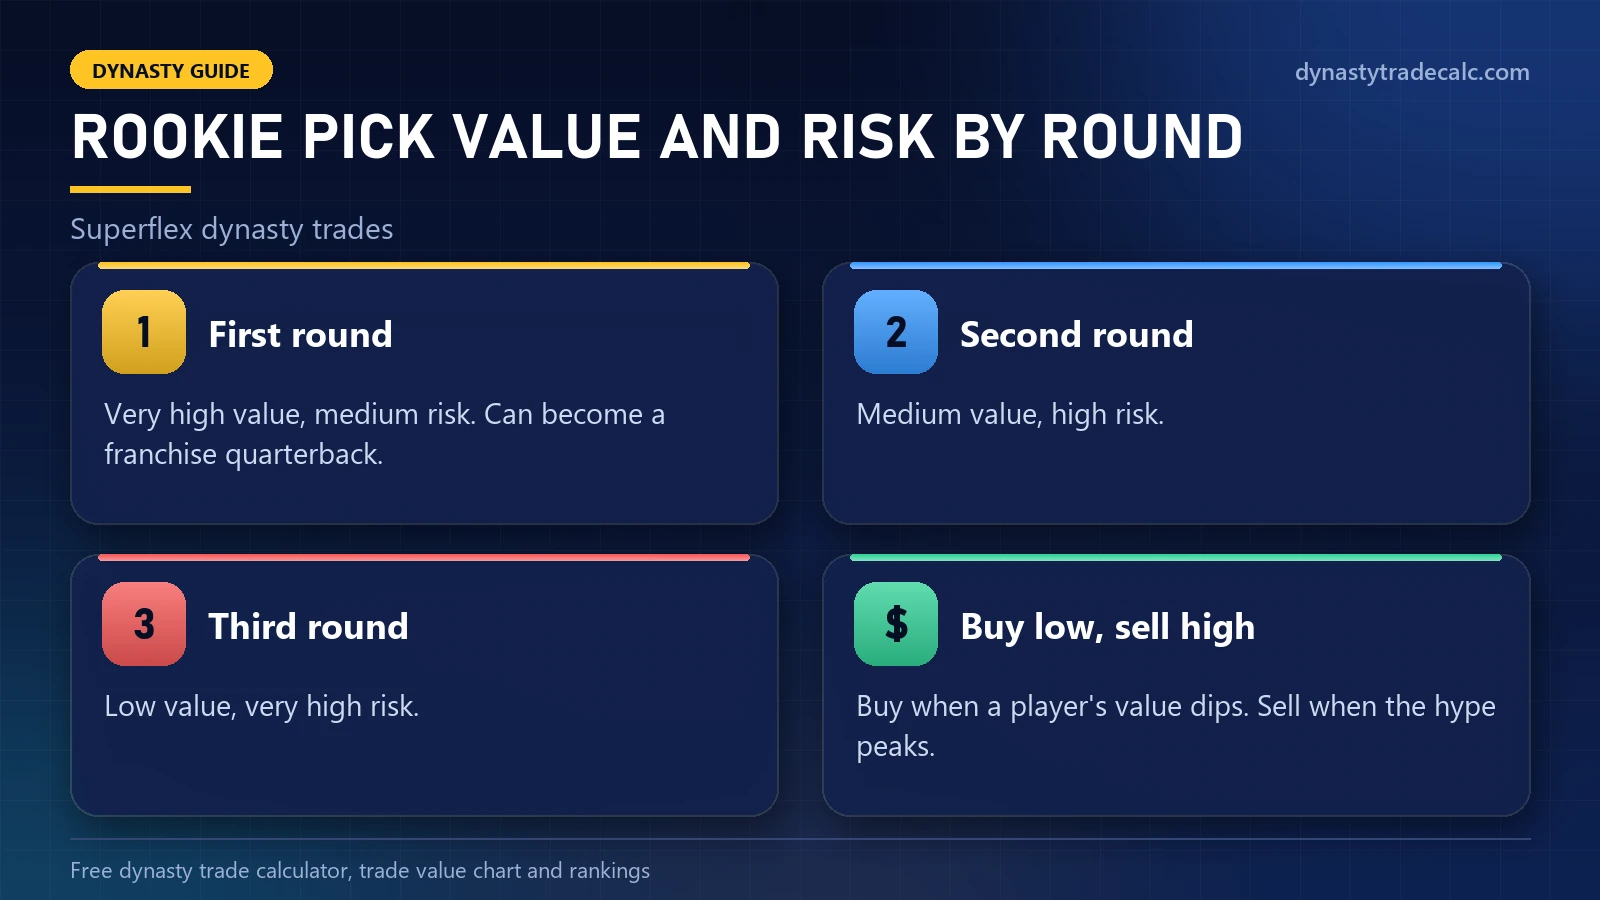
| Pick Range | Value Strength | Risk Level |
|---|---|---|
| 1st Round | Very High | Medium |
| 2nd Round | Medium | High |
| 3rd Round | Low | Very High |
Compare a pick with a proven player before you trade it. Current slot values are on our rookie pick values page.
Superflex Value by Position at a Glance
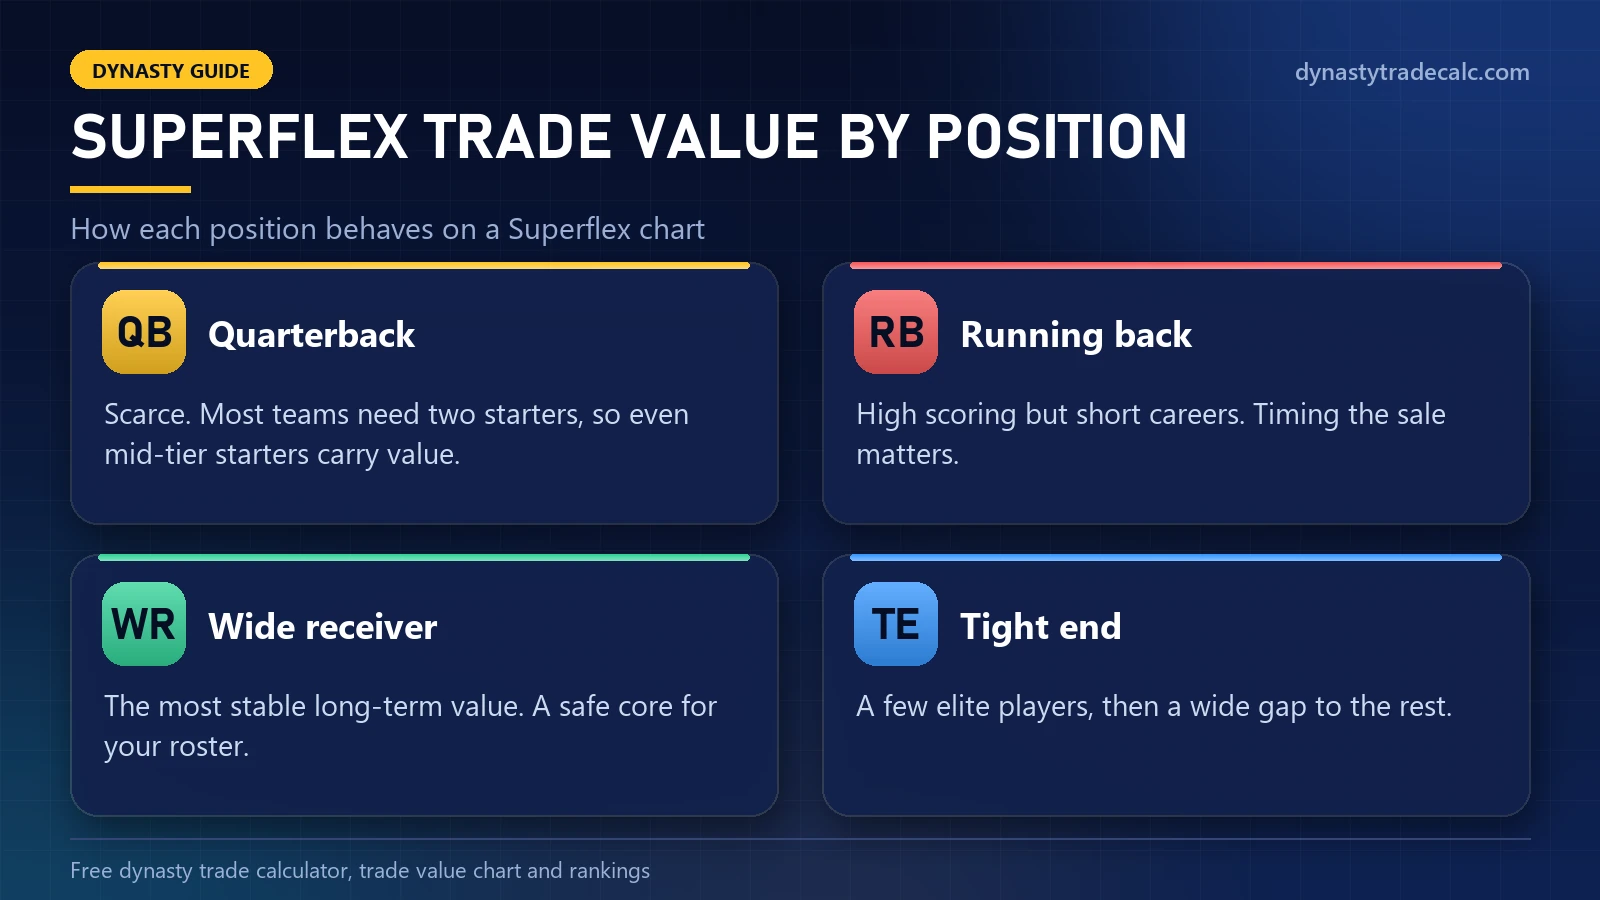
| Position | Value pattern in Superflex | What to do |
|---|---|---|
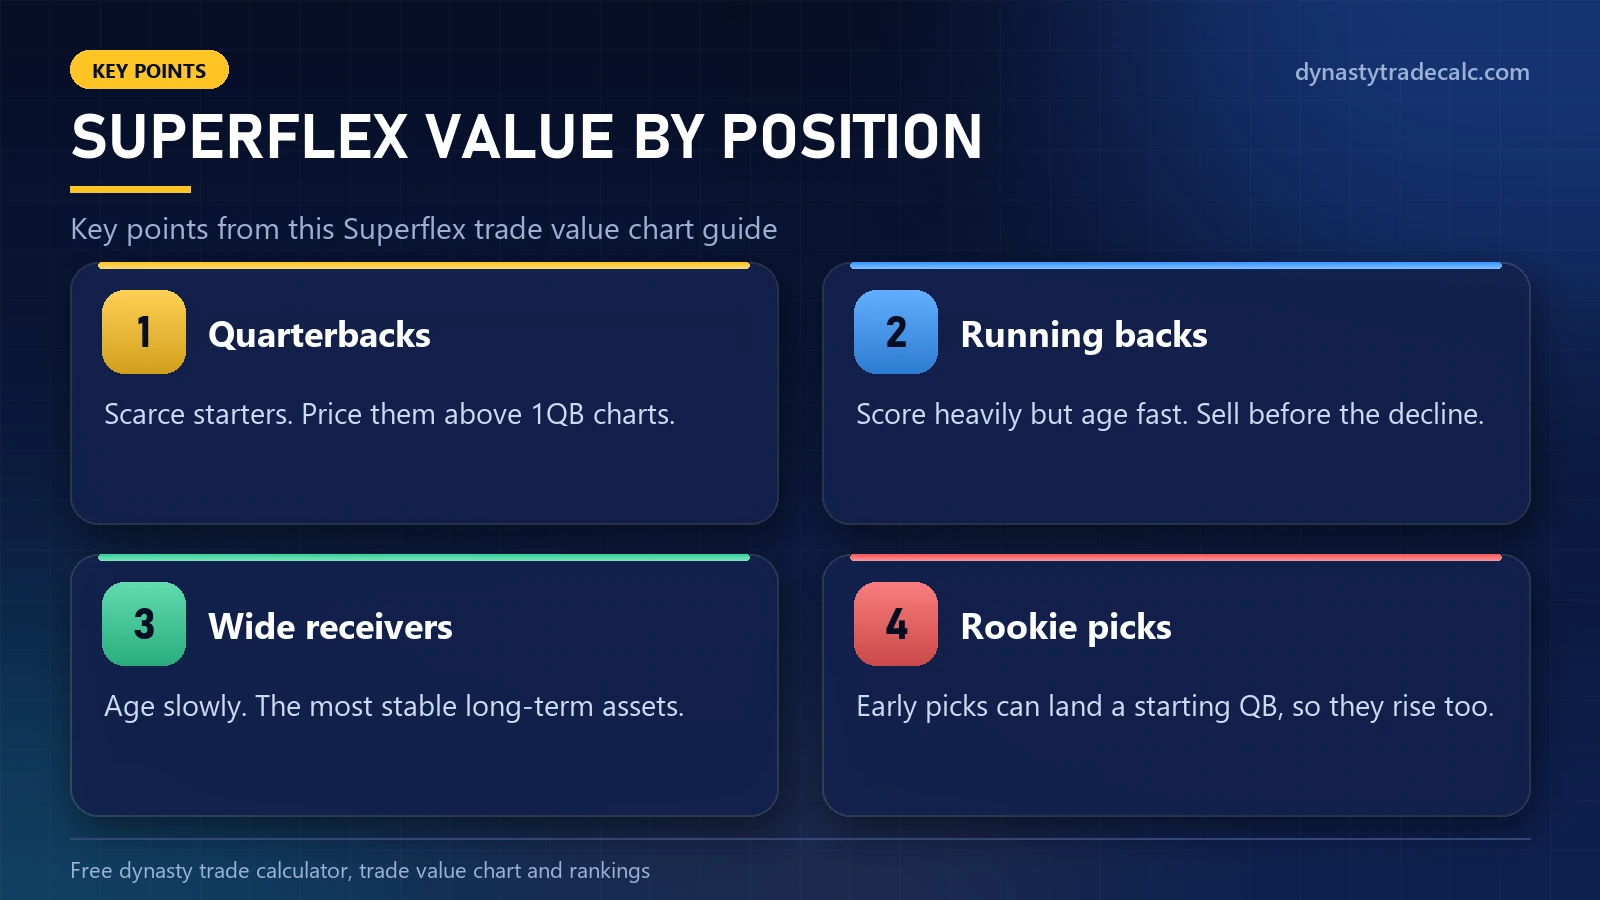
| Quarterback | Scarce. Most teams need two starters. | Protect your starters and price them above 1QB charts. |
| Running back | High scoring, short careers. | Sell before the decline, not after. |
| Wide receiver | The most stable long-term value. | Build your core here. |
| Tight end | A few elite players, then a wide gap. | Pay for the top tier or wait. |
| Rookie picks | First-round picks carry very high value. | Compare a pick with a proven player before you move it. |
Buy Low and Sell High Trade Strategy
Smart dynasty managers use emotional swings to their advantage. When a player performs poorly, their value drops. That is often the perfect buy opportunity. When hype explodes, that becomes a sell signal.
For example, a rookie receiver after one breakout game may become overvalued quickly. If you sell at peak hype, you gain long-term advantage. Compare the current Superflex trade value chart with last month’s to spot those swings early.
Mistakes to Avoid in Dynasty Trades
Many managers lose value because they chase short-term points instead of long-term stability.
Another major mistake is ignoring quarterback scarcity in superflex formats. QBs are the foundation of your roster. Trading them cheaply often creates long-term imbalance that is hard to recover from. More traps are listed in the biggest dynasty trade mistakes.
FAQ
What is a superflex trade value chart used for?
A Superflex trade value chart puts a value on every player for leagues that can start two quarterbacks. You use it to compare both sides of a dynasty trade, so the decision rests on value instead of guesswork.
Why are quarterbacks so valuable in superflex leagues?
Because you can start two of them. Demand goes up while the number of reliable starters stays the same, so quarterback trade value rises above most other positions.
How often should a Superflex chart be updated?
During the NFL season, check for updates every week, because injuries and role changes move values quickly. In the offseason, check again after free agency and the NFL Draft.
Are rookie picks included in Superflex value charts?
Yes. Rookie picks are included because they stand for future talent and carry real trade value. First-round picks are worth the most, and value falls quickly in later rounds.
Which position is the most stable in Superflex dynasty leagues?
Wide receivers are usually the most stable. They age more slowly than running backs and often improve with experience, so their value holds from one season to the next.
Is a Superflex chart different from a 1QB chart?
Yes. A Superflex chart ranks quarterbacks far higher, because most teams start two. Using a 1QB chart for a Superflex trade will undervalue every quarterback in the deal.
Where can I find a Superflex trade value chart?
Our dynasty trade value chart lists player values for both 1QB and Superflex leagues. It is an editorial snapshot, so check the last-updated date and compare it with a second source before a big trade.
Related Guides
Compare With Other Sources
Format changes value more than almost anything else. For a second opinion on these numbers, compare KeepTradeCut crowd-sourced dynasty values, FantasyCalc and DynastyProcess. You can also run the same trade through our Superflex dynasty trade calculator. To read a result line by line, see our dynasty trade analyzer free guide. For how to read the index, tier and format columns, see our fantasy trade value chart guide.
